How I built an Amazon Ads analytics dashboard with Puppeteer Stealth + PostgreSQL — and cut weekly reporting from 4 hours to 5 minutes
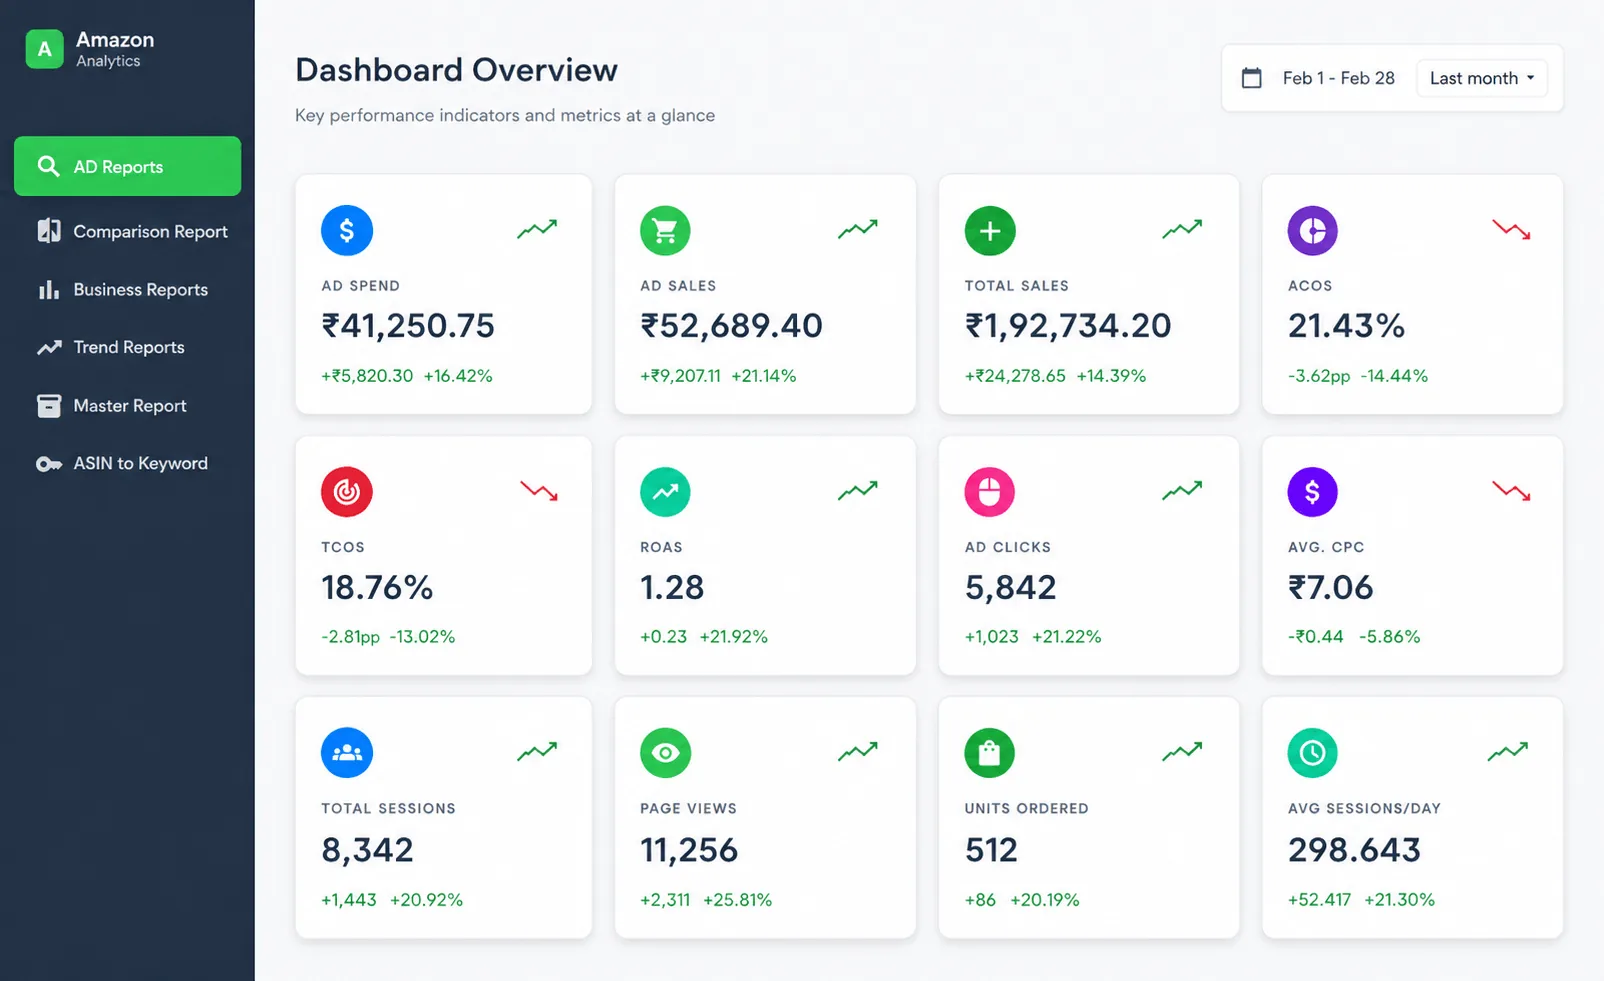
A team I worked with sold on Amazon India. Every Monday, the same painful ritual: someone logs into Seller Central, downloads ad reports for ~18 ASINs, opens each one in Excel, runs VLOOKUPs against last week's data, and spends 3–4 hours producing a single ACOS/ROAS report. By Friday, the report was already stale.
I replaced that whole pipeline with a Node.js + PostgreSQL + Puppeteer Stealth dashboard. Weekly reporting now takes about 5 minutes — and the 5 minutes is just looking at the dashboard, not generating it.
Here's how it works, and the parts that turned out harder than expected.
The problem with "just use the Amazon Ads API"
Spoiler: the Amazon Advertising API would have been the textbook answer. It wasn't an option for two reasons:
- Keyword-level rank data isn't exposed cleanly through the official API — you can get spend, impressions, CTR, ACOS, but week-over-week organic vs sponsored rank tracking for specific keywords requires the Seller Central UI views.
- Onboarding the API for a third-party agency-managed account is a multi-week approval process that wasn't going to happen.
So: browser automation it was.
Architecture, 10,000-foot view
┌──────────────────┐    cron (Mon 06:00 IST)    ┌──────────────────┐
│ Puppeteer Stealth│───────────────────────────▶│ Seller Central UI│
│  worker (Node)   │◀────── raw HTML/JSON ──────│                  │
└────────┬─────────┘                            └──────────────────┘
         │ parsed rows
         ▼
┌──────────────────┐                            ┌──────────────────┐
│   PostgreSQL     │◀───────── reads ───────────│  Next.js dashbd  │
│  (rank history,  │                            │ (ACOS/ROAS/CPR,  │
│   ad spend, CPR) │                            │  W-o-W charts)   │
└──────────────────┘                            └──────────────────┘
Three moving parts: a scraper worker, a PostgreSQL store, and a Next.js dashboard. The whole stack runs on a single small VPS.
Puppeteer Stealth: the part that actually broke
The first version of the scraper used vanilla Puppeteer. It worked for exactly two runs before Seller Central started serving a captcha and then locking the account out for ~6 hours.
Two things made it work reliably:
1. puppeteer-extra-plugin-stealth patches the obvious bot-detection signals — the navigator.webdriver flag, missing plugins arrays, the WebGL vendor string, that sort of thing. It's not magic but it gets you past the basic checks.
import puppeteer from 'puppeteer-extra'
import StealthPlugin from 'puppeteer-extra-plugin-stealth'

puppeteer.use(StealthPlugin())

const browser = await puppeteer.launch({
  headless: 'new',
  args: [
    '--no-sandbox',
    '--disable-blink-features=AutomationControlled',
  ],
})
2. Session reuse. The expensive part isn't scraping — it's logging in. Amazon's login flow has 2FA, device-trust prompts, the works. Instead of logging in every Monday, the worker saves the post-login cookies + localStorage to disk after the first manual run, and reuses them. The session typically stays alive for 2–3 weeks before needing a refresh.
// Save once after manual auth
const cookies = await page.cookies()
await fs.writeFile('session.json', JSON.stringify(cookies))

// Restore every run
const saved = JSON.parse(await fs.readFile('session.json'))
await page.setCookie(...saved)
Combined: zero manual login on the weekly run, no captcha walls.
PostgreSQL schema — the rank-history trick
The non-obvious schema design is the rank history. You want to answer questions like "how did keyword X rank for ASIN Y, sponsored vs organic, on the same Monday in each of the last 12 weeks?"
Storing one row per (asin, keyword, week, position_type) makes this trivially queryable:
CREATE TABLE rank_history (
  id          BIGSERIAL PRIMARY KEY,
  asin        TEXT NOT NULL,
  keyword     TEXT NOT NULL,
  week_start  DATE NOT NULL,
  position_type TEXT NOT NULL CHECK (position_type IN ('organic','sponsored')),
  rank        INT,
  fetched_at  TIMESTAMPTZ DEFAULT now(),
  UNIQUE (asin, keyword, week_start, position_type)
);

CREATE INDEX idx_rank_lookup ON rank_history (asin, keyword, week_start DESC);
Across 18 ASINs and ~3,500 tracked keywords, this table grows by roughly 7,000 rows per week — trivial for Postgres. The UNIQUE constraint means the scraper can be re-run safely if it crashes halfway through (ON CONFLICT DO UPDATE).
The dashboard — what actually got used
I built seven pages, but two of them get 80% of the daily traffic:
- Comparison view — same keyword, same ASIN, organic rank vs sponsored rank, side by side, current week vs last week. This is the "what changed?" view people open first thing Monday.
- ASIN Engine — for a given ASIN, the top 50 keywords by traffic, with week-over-week movement arrows. This is what informs the next week's bid changes.
The other five pages (ad spend, ROAS, CPR scores, session/page-view trends, the keyword-to-ASIN reverse lookup) are used weekly but not daily.
What "CPR" means here, and why it gets its own page
CPR (Cost Per Rank) in this context = total ad spend on a keyword ÷ the number of rank positions gained that week. It's not an Amazon metric — we derived it from the rank history and spend tables. Surprisingly useful for catching keywords where you're burning ad budget for zero ranking movement, which is usually a sign that the listing itself needs work, not the bid.
Numbers that actually moved
- Weekly reporting: 3–4 hours → under 5 minutes
- Manual logins: every Monday → zero
- Keyword rows tracked: 0 (Excel only had the last 4 weeks) → 3,500+ keywords × 52+ weeks of history
- Surfaced bid decisions: pure gut feeling → backed by 12 weeks of organic vs sponsored rank data
What I'd do differently
- Headless Chromium in Docker, not on a host VPS. The container died once when an Ubuntu security update reset Chrome's binary path. Should have pinned a
mcr.microsoft.com/playwrightbase image from day one. - Materialised views for the weekly aggregations. I left the dashboard queries as raw joins. Once the rank_history table crossed ~200k rows, the comparison page started loading in 800ms instead of 80ms. A weekly
REFRESH MATERIALIZED VIEWwould fix it; haven't done it yet. - Email/Slack alerts on rank drops. Right now you have to open the dashboard to know a key keyword dropped 20 positions. A weekly Slack digest would be 2 hours of work and a clear win.
Stack, in one block
- Scraper: Node.js + Puppeteer Stealth + cron
- Storage: PostgreSQL 15 (one table for raw scrapes, one for derived metrics)
- Dashboard: Next.js + React, queries over a thin Node API
- Hosting: Single 2GB Hetzner VPS, ~₹400/month
Nothing exotic. The leverage came from the schema + the scheduler, not the stack.
I'm Gaurav Kumar — full-stack developer building React + Node products for finance and e-commerce teams in India. More projects + a long writeup on the four finance dashboards I shipped at the next post or back at the portfolio home.