I built 4 finance dashboards in 9 months — here's the React + Node playbook that worked every time
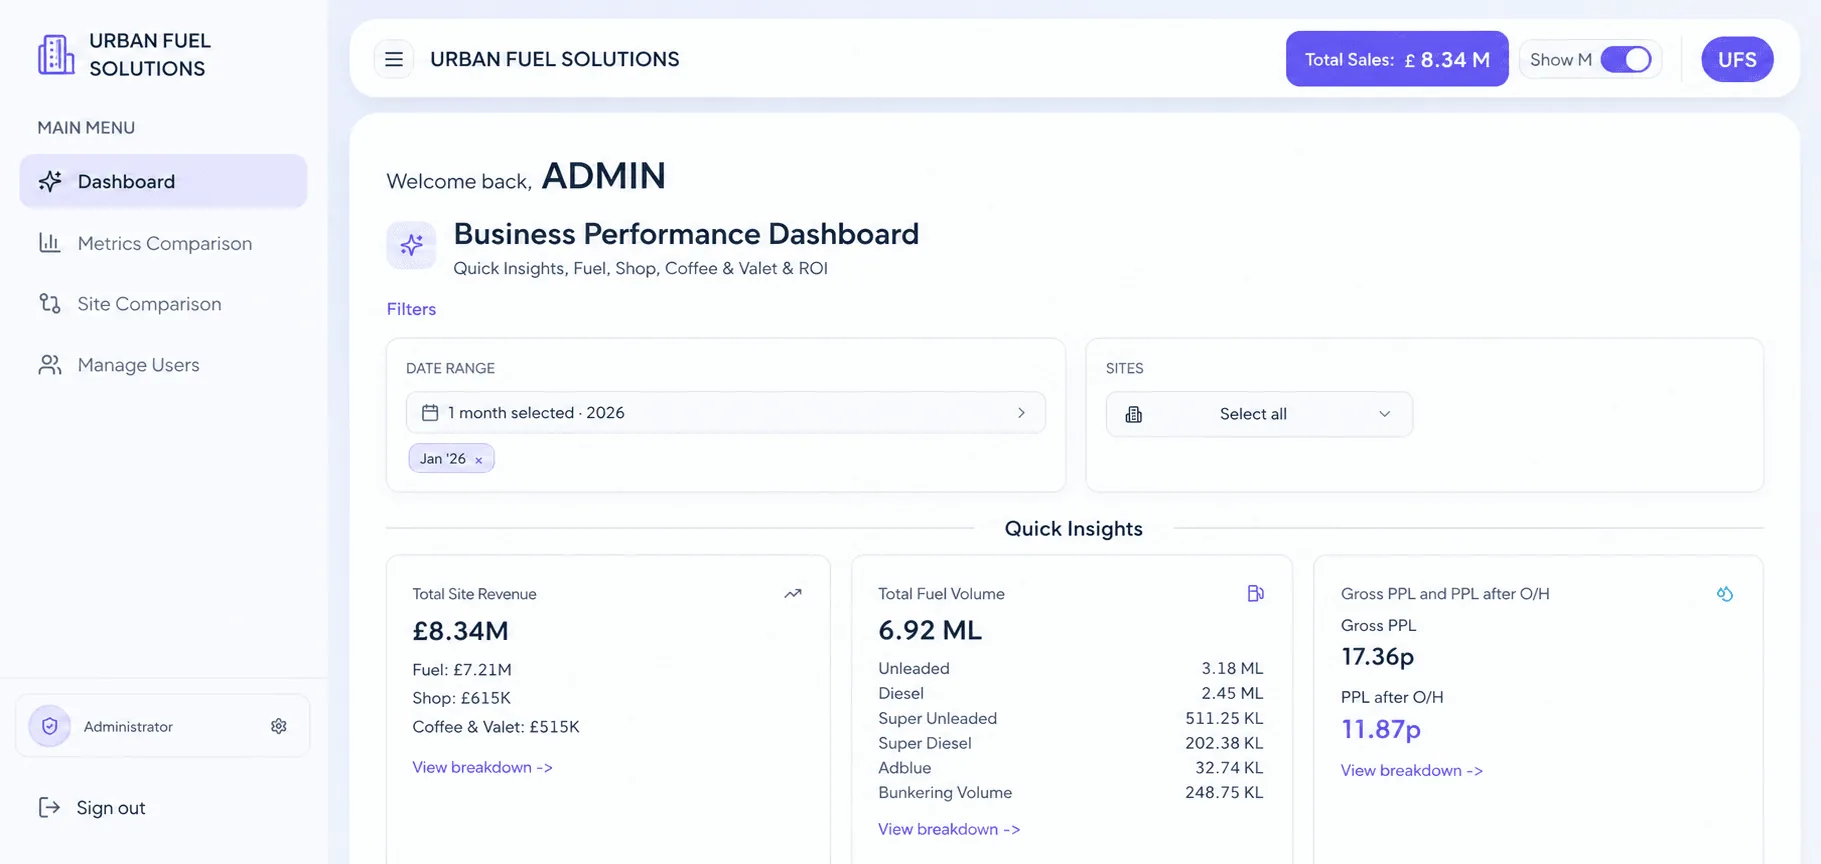
A CFO once told me: "Our spreadsheets are correct. They're just always two weeks late." That sentence is the entire reason finance dashboards exist. Not because Excel is wrong — because the moment the right number arrives matters as much as the number itself.
Over the last 9 months I've shipped four production finance dashboards for the same operations team — different domains (reconciliation, AR aging, P&L by entity, expense automation) but the same underlying problems every time. This is the playbook I now reuse on every new one.
Quick question before you read on — which one of these do you spend the most time on?
- Manual reconciliation between two source systems
- Chasing receivables / AR aging reports
- P&L breakdowns by entity or segment
- Expense categorisation and approval
Whichever it was, the same five patterns apply.
Pattern 1: The "source of truth vs source of speed" split
Every finance dashboard has the same architectural choice in the first 48 hours:
| Option | Source of truth | Source of speed |
|---|---|---|
| A | ERP / accounting system directly | Read live, slow but always correct |
| B | A Postgres mirror, refreshed nightly | Read fast, can be slightly stale |
I now pick B every single time, with one caveat: a "Last refreshed: 2h 14m ago" badge in the top-right of every page. Finance teams trust slightly-stale data they can see is stale far more than live data that occasionally times out.
The freshness badge component — copy-pasteable
function FreshnessBadge({ lastSyncAt }) {
  const ageMin = Math.floor((Date.now() - new Date(lastSyncAt)) / 60000)
  const stale = ageMin > 60 * 4   // > 4h = warn
  return (
    <span className={`badge ${stale ? 'badge--warn' : 'badge--ok'}`}>
      {stale ? '⚠' : '●'} Last refreshed {ageMin}m ago
    </span>
  )
}
Show this on every page. It singlehandedly cut "is this number right?" questions in half.
Pattern 2: One denormalised reporting table per dashboard
Finance data lives in 6–10 normalised tables — invoices, line items, customers, payments, journal entries, exchange rates, GL accounts, departments. Joining 8 tables on every dashboard load is how you end up with 12-second page loads.
I now build a single denormalised reporting view per dashboard that pre-joins everything the UI needs:
CREATE MATERIALIZED VIEW ar_aging_report AS
SELECT
  i.invoice_id,
  i.invoice_no,
  c.customer_name,
  c.entity,
  i.due_date,
  i.amount_inr,
  i.amount_inr - COALESCE(SUM(p.amount_inr), 0) AS outstanding,
  CASE
    WHEN i.due_date >= CURRENT_DATE THEN '0_current'
    WHEN i.due_date >= CURRENT_DATE - 30 THEN '1_30d'
    WHEN i.due_date >= CURRENT_DATE - 60 THEN '2_60d'
    WHEN i.due_date >= CURRENT_DATE - 90 THEN '3_90d'
    ELSE '4_90plus'
  END AS aging_bucket
FROM invoices i
JOIN customers c ON c.customer_id = i.customer_id
LEFT JOIN payments p ON p.invoice_id = i.invoice_id
GROUP BY i.invoice_id, i.invoice_no, c.customer_name, c.entity, i.due_date, i.amount_inr;

CREATE INDEX idx_aging_entity ON ar_aging_report (entity, aging_bucket);
REFRESH MATERIALIZED VIEW nightly (or every hour for the live ones). Page loads dropped from 4–8 seconds to 80–200ms across every dashboard I applied this to.
Pattern 3: Server-side aggregation, browser-side filtering
Finance users do two things on every page:
- Look at a total (server-aggregated, can't be done in JS at scale)
- Filter by entity / department / date range / customer (instant feedback expected)
The mistake is doing both server-side. Every filter click → spinner → 600ms wait → answer. Users will stop clicking filters.
The pattern: return ~2,000 pre-aggregated rows from the server, do all filtering, sorting, and grouping in the browser with React state + useMemo.
const filtered = useMemo(() =>
  rows
    .filter(r => entity === 'all' || r.entity === entity)
    .filter(r => bucket === 'all' || r.aging_bucket === bucket)
    .sort((a, b) => b.outstanding - a.outstanding),
  [rows, entity, bucket]
)
2,000 rows is the sweet spot — small enough to keep in memory, large enough that 95% of finance dashboards never need pagination on the result.
Pattern 4: Excel export is not optional
Every finance dashboard I ship has a CSV export button. Every single one. Without exception.
Finance teams will absolutely use your dashboard for daily monitoring — and then email the same numbers in Excel to their auditor. If your dashboard doesn't export, they will rebuild it in Excel anyway, and now they have two sources of truth instead of one.
// Server-side, returns text/csv with proper headers
app.get('/api/ar-aging/export', async (req, res) => {
  const rows = await db.query('SELECT * FROM ar_aging_report WHERE entity = $1', [req.query.entity])
  res.setHeader('Content-Type', 'text/csv')
  res.setHeader('Content-Disposition', 'attachment; filename="ar-aging.csv"')
  res.write('Invoice,Customer,Entity,Due Date,Outstanding,Bucket\n')
  rows.forEach(r => res.write(`${r.invoice_no},${r.customer_name},${r.entity},${r.due_date},${r.outstanding},${r.aging_bucket}\n`))
  res.end()
})
Five lines. Massive trust-building.
Pattern 5: Audit log on every write — yes, even for "small" ones
The reconciliation dashboard had one button: "Mark as matched". It took me three weeks to realise that without an audit log, the team couldn't trust their own dashboard during month-end close — they had no way to answer "who marked this matched?" when an auditor asked.
CREATE TABLE audit_log (
  id          BIGSERIAL PRIMARY KEY,
  user_id     TEXT NOT NULL,
  action      TEXT NOT NULL,         -- 'mark_matched', 'unmatch', 'override'
  entity_type TEXT NOT NULL,         -- 'invoice', 'payment', 'reconciliation'
  entity_id   TEXT NOT NULL,
  before_json JSONB,
  after_json  JSONB,
  created_at  TIMESTAMPTZ DEFAULT now()
);

CREATE INDEX idx_audit_entity ON audit_log (entity_type, entity_id, created_at DESC);
If you're writing data the team will sign off on, log who, what, when, before, after. Always. It's two hours of work that wins you the team's trust permanently.
What didn't work (so you can skip these mistakes)
Things I tried that I won't try again
- Real-time websocket updates for financial figures. Finance numbers don't need to be live — they need to be correct. Websockets added 200 lines of code and zero user value.
- Letting users save custom views server-side. Sounds great in a demo. In practice, nobody used it after week 2. A URL with query params (
?entity=acme&bucket=90plus) does the same job and people share it on Slack. - Charts before tables. Finance people want the table first, the chart second. I now build the table, ship it, then add the chart in v2 if anyone asks. (Usually they don't.)
- My own auth. Use whatever the company already has — Google Workspace SSO, Microsoft Entra, Clerk if greenfield. Building your own login for an internal finance tool is a six-week mistake.
Numbers that moved
Across the 4 dashboards combined:
- Weekly reporting cycles: ~70% time reduction (was ~12 hours team-wide, now ~3.5 hours)
- Manual reconciliation / categorisation steps automated: 60%+ of the old workflow
- Month-end close: previously 7 working days, currently 4 working days (and falling)
These aren't from one tool. They're from applying the same five patterns above, every time, on a different finance problem.
Stack, in one block
- Backend: Node.js + Express + PostgreSQL (with materialised views)
- Frontend: React + Redux Toolkit + a small custom component library (no chart library bloat —
rechartsonly when needed) - Auth: Whatever the company already has — JWT in HTTP-only cookies, never localStorage
- Hosting: Whatever's cheapest that keeps Postgres next to the API server
Your turn — if you build a finance dashboard from scratch tomorrow, which of the 5 patterns would you copy first? It's #2 for me — the denormalised view fixes more performance problems than any other single thing.
I'm Gaurav Kumar — full-stack developer building React + Node products for finance and e-commerce teams in India. The Amazon analytics writeup (different architecture, equally fun) lives here, and four more projects at the portfolio home.