Amazon India Analytics Dashboard — case study
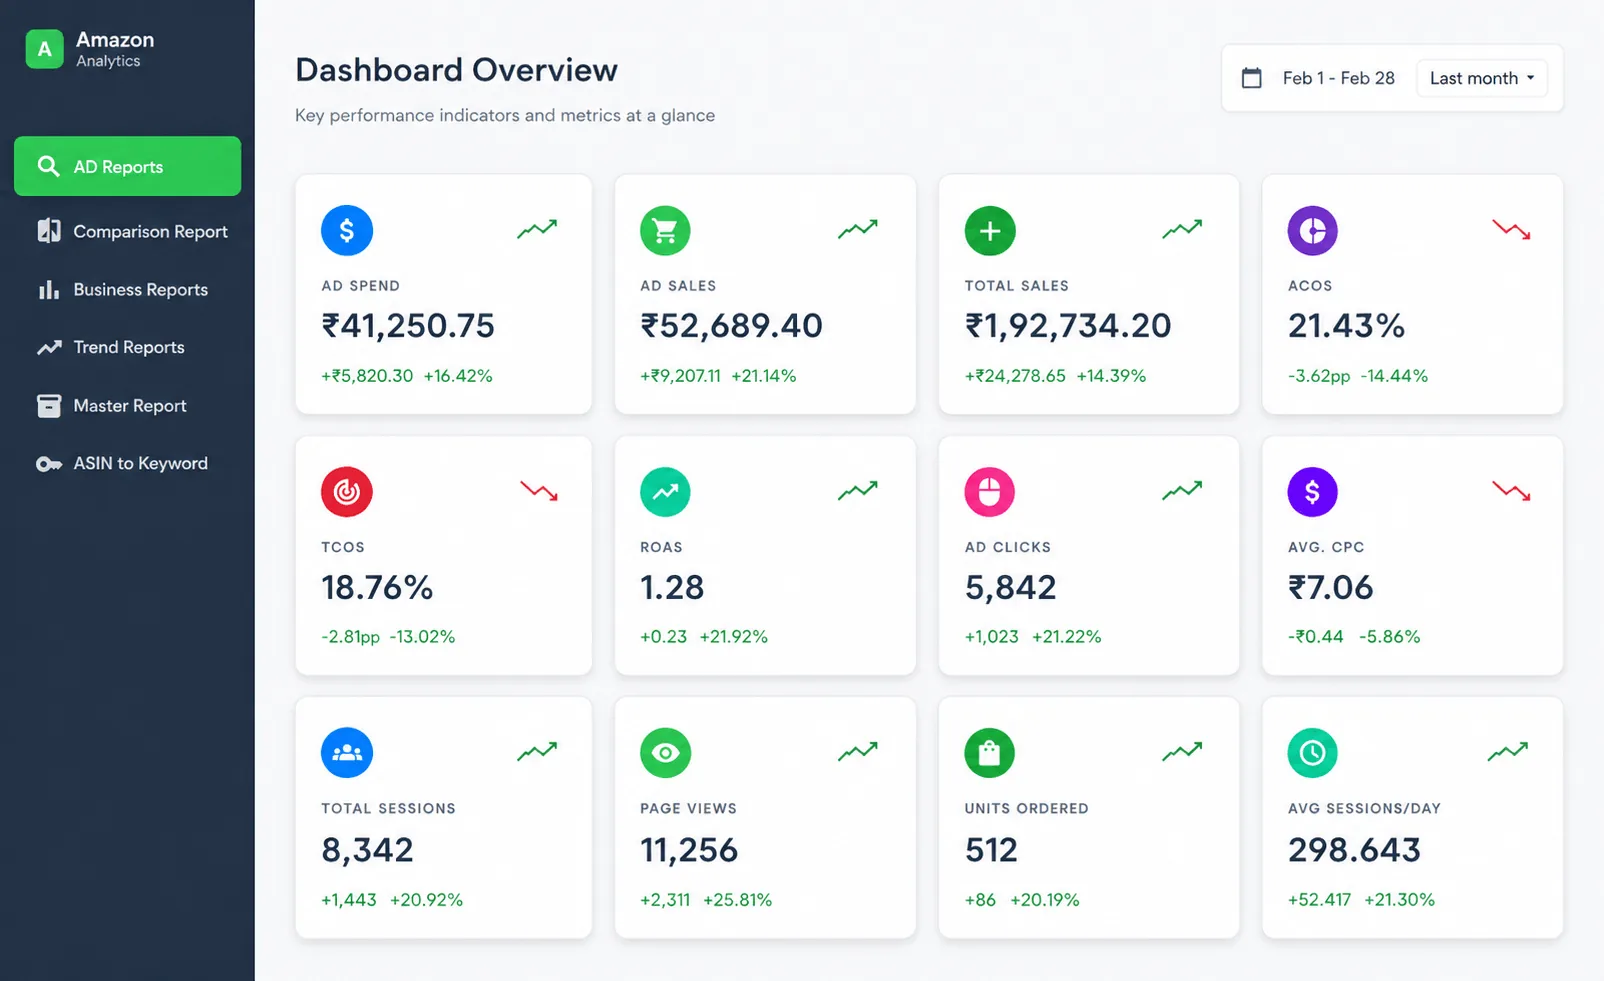
A seven-page Amazon India advertising analytics platform tracking ACOS, ROAS, CPC and ad spend across 18 ASINs and 3,500+ keywords. Puppeteer Stealth scrapes Seller Central weekly; PostgreSQL stores rank history; Next.js exposes the dashboard. Replaced 3–4 hours of weekly manual reporting with 5 minutes of dashboard review.
The problem
Every Monday morning, the ads team logged into Amazon Seller Central, downloaded reports for ~18 ASINs, opened each one in Excel, ran VLOOKUPs against last week's data, and spent 3–4 hours producing a single ACOS/ROAS report. By Friday the report was already stale. The Amazon Advertising API would have been the textbook answer, but two constraints ruled it out:
- Keyword-level rank data is not exposed cleanly through the official API — week-over-week organic vs sponsored rank for specific keywords requires the Seller Central UI views.
- Onboarding the API for a third-party agency-managed account is a multi-week approval process that was not going to happen.
The solution at a glance
Three moving parts running on a single small VPS:
┌──────────────────┐    cron (Mon 06:00 IST)    ┌──────────────────┐
│ Puppeteer Stealth│───────────────────────────▶│ Seller Central UI│
│  worker (Node)   │◀────── raw HTML/JSON ──────│                  │
└────────┬─────────┘                            └──────────────────┘
         │ parsed rows
         ▼
┌──────────────────┐                            ┌──────────────────┐
│   PostgreSQL     │◀───────── reads ───────────│  Next.js dashbd  │
│  (rank history,  │                            │ (ACOS/ROAS/CPR,  │
│   ad spend, CPR) │                            │  W-o-W charts)   │
└──────────────────┘                            └──────────────────┘
Stack
- Scraper: Node.js +
puppeteer-extra-plugin-stealth, headless Chromium, cron-triggered Mondays 06:00 IST - Database: PostgreSQL — one denormalised rank-history table indexed on (keyword_id, captured_at) for window-function queries
- Dashboard: Next.js (Pages Router) + React + Tailwind, server-rendered for first paint with client-side filtering
- Hosting: Single small DigitalOcean droplet, NGINX + PM2, weekly DB backup to S3
The seven pages
- Ad Reports — ACOS, ROAS, CPC, ad spend, click rate per ASIN, week-over-week
- Keyword Rank — organic and sponsored rank history per keyword, with sparkline trend
- ASIN Performance — per-ASIN deep dive with conversion funnel and category share
- Weekly Comparison — side-by-side last week vs this week deltas, colour-coded
- Category Tools — category-level performance breakdown with drill-down
- Activity Tool — audit log of every scrape, every parse, every write
- User Management — role-based access (admin, ads team, viewer)
The schema trick that mattered most
The non-obvious decision was storing rank history as one denormalised flat table — keyword_rank_history(keyword_id, asin, captured_at, organic_rank, sponsored_rank, ad_spend, impressions, clicks, acos, roas) — instead of a normalised star schema. PostgreSQL window functions over this table (LAG(), FIRST_VALUE() OVER (PARTITION BY keyword_id ORDER BY captured_at)) made week-over-week and cohort queries trivially fast. The full architecture is documented in the accompanying engineering writeup.
What broke and how it was fixed
The first version of the scraper used vanilla Puppeteer. It worked for exactly two runs before Seller Central started serving a captcha and locking the account out for ~6 hours. Two changes made it reliable:
- Stealth plugin — patches
navigator.webdriver, plugin arrays, the WebGL vendor string, and a dozen other bot-detection signals - Persistent browser context — keep cookies and session storage across runs so each scrape looks like a returning user, not a fresh login
Results
Related
- Engineering writeup: how I built it (architecture, schema, the part that broke)
- Hire me to build something similar →
Building something on Amazon Seller Central and stuck on the data layer? Gauravthakur1k@gmail.com