Four finance dashboards in nine months — case study
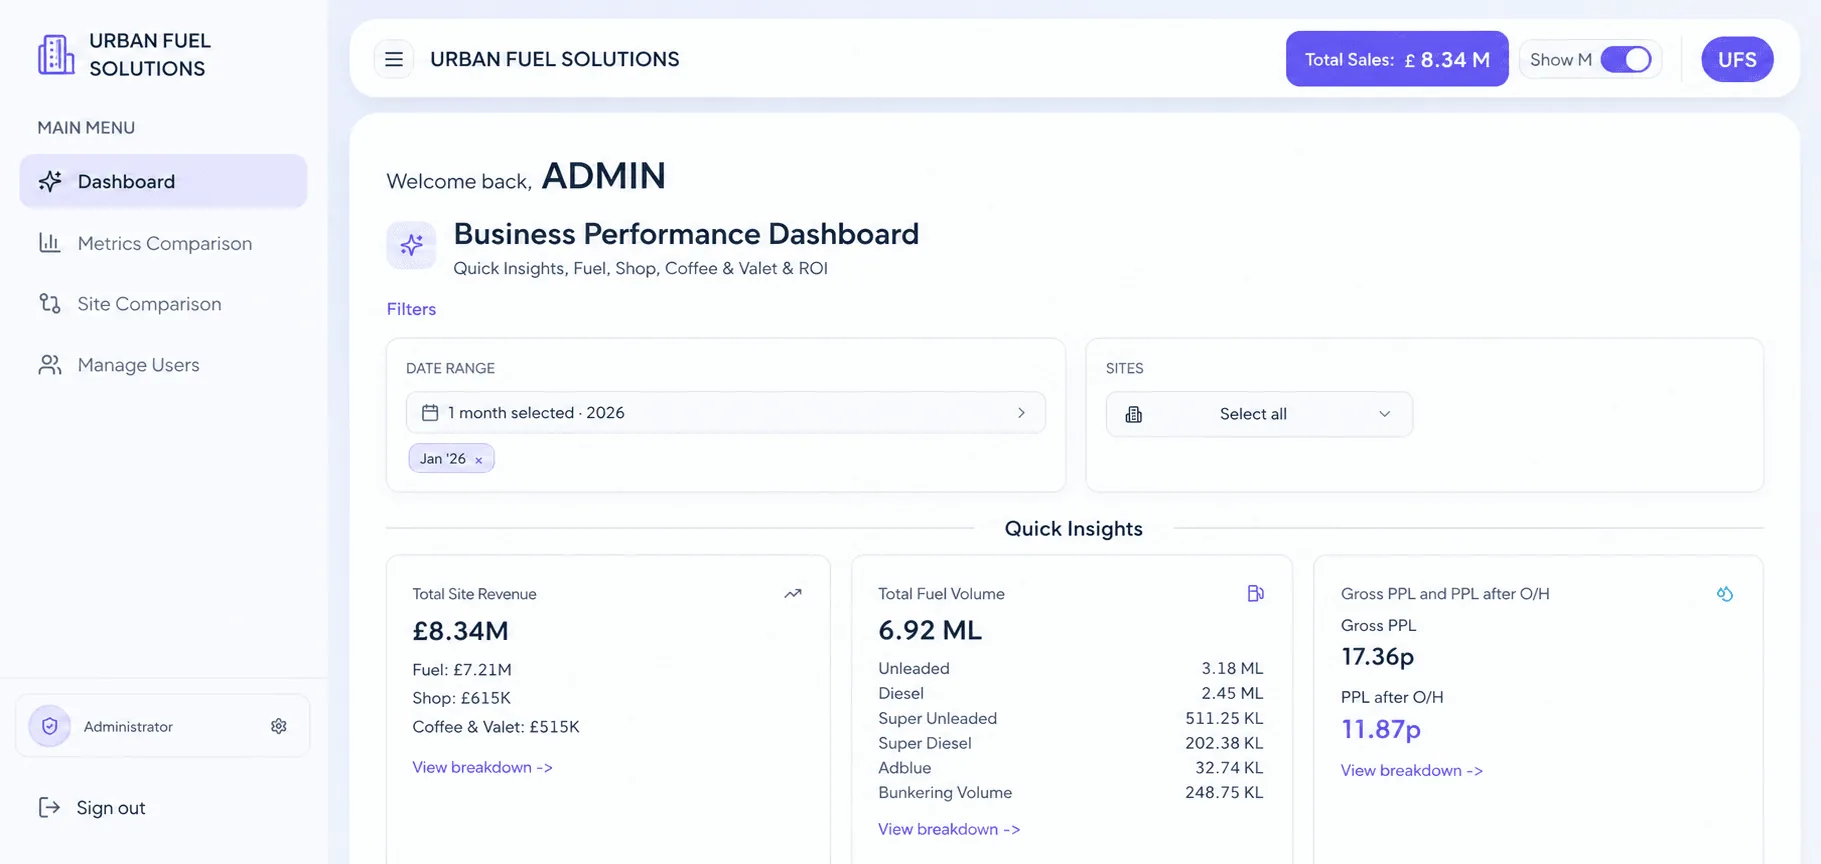
Four production finance dashboards built at B3 Solution between July 2024 and April 2025: P&L by entity, AR aging, bank-to-ledger reconciliation, and expense automation with approval workflows. React + Node + PostgreSQL across all four. Combined impact: weekly reporting time cut by 70%, 60%+ of manual workflows automated, four finance teams that now open the dashboard every Monday instead of a spreadsheet.
The four projects
1. P&L by entity
Multi-entity P&L with drill-down to ledger account. Real-time roll-up from individual entity ledgers into a consolidated view with elimination entries. Server-rendered first paint, client-side filtering for the analyst loop.
2. AR aging
Accounts-receivable aging buckets (0–30 / 31–60 / 61–90 / 90+ days) with cohort tracking week-over-week. Customer-level drill-in showing every invoice, every payment, and the aging trajectory.
3. Bank-to-ledger reconciliation
Daily bank statement import (CSV upload + parser), automatic matching to ledger entries on amount + date + memo, and a manual reconciliation queue for everything the matcher could not resolve. Replaced four hours of daily reconciliation with about 30 minutes of exception review.
4. Expense automation
Employee expense submission with receipt OCR, multi-level approval workflow (manager → finance → CFO depending on amount), and direct push to the accounting system once approved. Includes a freshness badge and an audit log on every state transition.
The five patterns that repeated
Different domains, same five underlying patterns:
- Denormalised reporting view. Every dashboard reads from a PostgreSQL view that is denormalised for the dashboard's exact queries — not the transactional schema. Faster queries, simpler frontend code, fewer joins to debug.
- Freshness badge. Every page shows when the underlying data was last refreshed. Finance teams will not trust a number they cannot date.
- Server-side aggregation with browser filtering. Heavy aggregations happen in Postgres; the frontend gets pre-aggregated rows and filters them locally. UX is instant, server load is bounded.
- CSV export, non-negotiable. Every list view and every chart has a CSV export. Finance teams will use the dashboard to find the numbers, then drop them into Excel. Pretending otherwise loses adoption.
- Audit log. Every state-changing action (approval, override, manual reconciliation) writes an immutable log entry. This is the single feature that won month-end trust.
The full playbook walks through each pattern with code snippets and the reasoning behind it.
Stack
- Frontend: React + Tailwind, React Query for server state, virtualised tables for 10,000+ row views
- Backend: Node.js + Express + Prisma, REST API with thin controllers and most logic in Postgres
- Database: PostgreSQL — denormalised reporting views, materialised views for the slow ones, regular indexed reads otherwise
- Auth: JWT in HTTP-only cookies, role-based access control (admin / finance / approver / viewer)
- Hosting: Vercel for the frontend, single VPS for the API and Postgres, weekly automated backups
Results, in numbers
Related
- Engineering writeup: the five patterns in detail
- Hire me to build a finance dashboard for your team →
Finance team drowning in spreadsheets? Gauravthakur1k@gmail.com — the first 30-minute scoping call is free.